- Avoid driving during bad weather
- Be extra careful in intersections
- Maintain enough distance between you and the vehicle ahead of you
- Keep both hands on the wheel
- Don’t drive when you’re sleepy
- Don't drive after even a small amount of alcohol
- Practice defensive driving
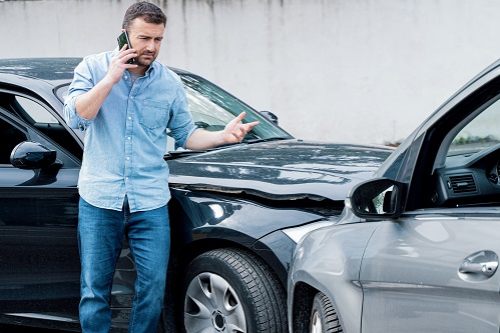
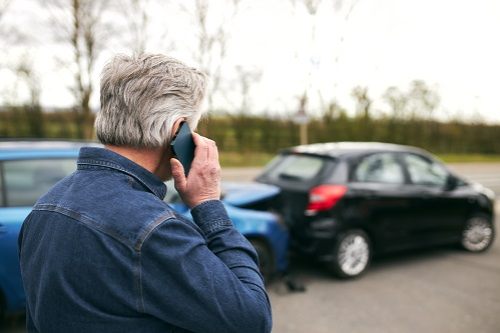
- Refrain from texting or calling while driving
- Get your tire pressure checked regularly
- Be sure to wear your seat belt properly
Avoid driving during bad weather
If you can avoid it, don't drive in bad weather. But if you have to drive, slow down and use caution. Here are some more tips:
- Fog: Avoid driving in fog. If you can't, set your headlights on regular (or low beam). If visibility becomes so poor that driving safely becomes impossible, pull as far off the road as you can and stop.
- Rain: Keep your windows from fogging up by using the defroster or air conditioner (if necessary, open the window slightly). Turn your lights on, day or night.
- Snow or ice: Brake gently and early, turn cautiously, and increase your following distance. And be alert for changing road conditions (such as patches of ice or slippery snow).
Be extra careful in intersections
Don't pull away from a sign or a light until you're sure other drivers are stopping or yielding. Wait a few seconds after a light turns green before proceeding to protect yourself from a driver running a red light.
Maintain enough distance between you and the vehicle ahead of you
Drivers commonly tailgate because they underestimate how much stopping distance they really need. In general, under good weather conditions, you need to keep at least three to four seconds between you and the car ahead of you if you're going below 40 mph to avoid traffic crashes.
Keep both hands on the wheel
Don't drive one-handed because if you're hit unexpectedly, you might lose control of your vehicle. Place both hands in a comfortable position on opposite sides of the steering wheel. And look ahead to anticipate obstacles you may need to steer around.
Don’t drive when you’re sleepy
Falling asleep at the wheel can occur at any time, but it's especially common late at night or early in the morning. If you find yourself getting sleepy at the wheel, try:
- Pulling over in a safe place and taking a break until you feel more alert.
- Opening a window for the breeze (or turning on the air conditioner if it's hot outside).
- Sharing the driving with someone else, especially if you are on a long trip.
Don't drive after even a small amount of alcohol
Even if you've only had a drink or to, don't get behind the wheel. Drinking alcohol affects your judgment and reaction time, and even a small amount can have an impact on your ability to drive safely.
Practice defensive driving
Defensive driving is the practice of being aware of the other vehicles around you and and predicting their behavior. It keeps you alert and can help you to avoid accidents.
Refrain from texting or calling while driving
People who talk on cell phones or text while driving are more likely to have accidents. If you must use your cell phone when you drive, use a hands-free device. But if the conversation is complicated or emotional, pull off the road to a safe location to talk.
Get your tire pressure checked regularly
Keep an inexpensive tire gauge in your vehicle and check your tire pressure every time you get gas (you can usually find the manufacturer's recommended pressure inside the door of your car or in your owner's manual). And inspect your tires regularly to spot cracks, bulging, worn spots, or shallow tread. Accidents caused by tire failure are preventable if you keep a close watch on your tire health.
Be sure to wear your seat belt properly
You must wear your seat belt regularly. If not, it may not protect you in an accident. Fasten lap and shoulder belts snugly, wearing the lap belt on your hips, not on your stomach. And wear your seat belt even if your car has an airbag. The airbag won't protect you from being thrown around or out of the car in an accident.
Sources:
- National Institute of health. “Alcohol’s damaging effects on the brain.” Accessed September 2022.
- Safemotorist.com. “Defensive driving.” Accessed September 2022
- Kreegerlaw.com. “Three-to-four second rule.” Accessed September 2022


